U Chart with Minitab
What is a U Chart?
The U chart is a type of control chart used to monitor discrete (count) data where the sample size is greater than one, typically the average number of defects per unit.
Defect vs. Defective
Remember the difference between defect and defective?
A defect of a unit is the unit’s characteristic that does not meet the customers’ requirements.
A defective is a unit that is not acceptable to the customers.
One defective might have multiple defects. One unit might have multiple defects but still be usable to the customers.
This control chart monitors the average defects per unit. It plots the count of defects per unit of a subgroup as a data point. It considers the situation when the subgroup size of inspected units for which the defects would be counted is not constant. The underlying distribution of the U-chart is Poisson distribution.
Use Minitab to Plot a U Chart
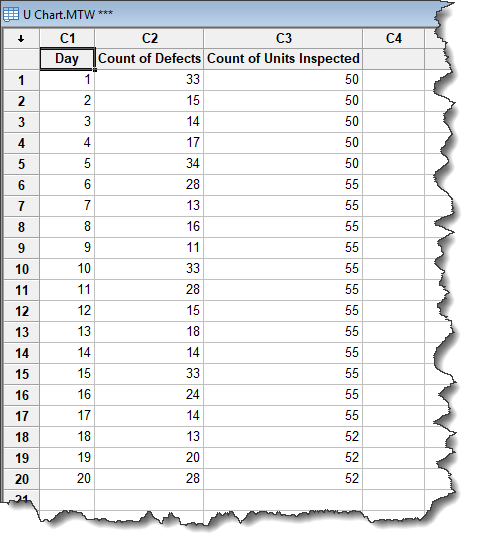
Data File: “U” tab in “Sample Data.xlsx”
Steps to plot a U chart in Minitab:
- Click Stat → Control Charts → Attributes Charts → U.
- A new window named “U Chart” appears.
- Select “Count of Defects” as the “Variables.”
- Select “Count of Units Inspected” as the “Subgroup Sizes.”

- Click the button “U ChartOptions” to open a window named “U Chart Options”.
- Click the tab “Tests.”
- Select the item “Perform all tests for special causes” in the dropdown menu.

- Click “OK” in the window “U Chart”
- Click “OK” in the window “U Chart.”
- The U chart appears in the newly-generated window.

U Chart Diagnosis
Model summary: Since the sample sizes are not constant over time, the control limits are adjusted to different values accordingly. The data point circled above falls beyond the upper control limit. We conclude that the process is out of control. Further investigation is needed to determine the special causes that triggered the unnatural pattern of the process.
Join Our Community
Instant access to hundreds of "How to" articles, Tools, Templates, Roadmaps, Data-Files.. Everything Lean Six Sigma! Come on in! Welcome to our community of Lean Six Sigma certified professionals.


It might be useful to see the data layout
Hi John,

Thanks for the question – below is a screen shot of the U chart data layout.