
Posts Tagged ‘Six Sigma’
Importance of the Six Sigma Primary Metric
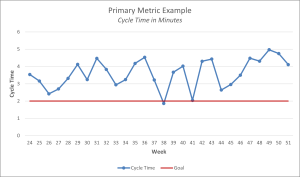
Six Sigma Primary Metric Primary Metric: The Six Sigma Primary Metric is mandatory! How does one know if a project does what it sets out to do? Every project must choose the right metrics to determine success. Primary metrics are the center point for the work to ensure that the direction and decisions made throughout…
Read MoreWhat is Six Sigma?
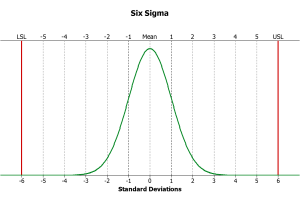
What is Six Sigma or Lean Six Sigma What is Six Sigma or what is today known as “Lean Six Sigma”? It is a data-driven methodology and process improvement approach that combines Lean and Six Sigma elements. It aims to improve organizational processes’ efficiency, quality, and effectiveness. Here’s a breakdown of the two components: Lean…
Read MoreEWMA Chart with JMP
What is EWMA Chart? The EWMA chart (Exponentially-Weighted Moving Average Chart) is a control chart monitoring the exponentially-weighted average of previous and present subgroup means. The more recent data get more weight than older data. It detects the shift of the process mean from the process target over time. The underlying distribution of the EWMA…
Read MoreEWMA Chart with Minitab
What is an EWMA Chart? The EWMA chart (Exponentially-Weighted Moving Average Chart) is a control chart monitoring the exponentially-weighted average of previous and present subgroup means. The more recent data get more weight than older data. It detects the shift of the process mean from the process target over time. The underlying distribution of the…
Read MoreCumSum Chart with JMP
What is a CumSum Chart? The CumSum chart (also called cumulative sum control chart or CUMSUM chart) is a control chart of monitoring the cumulative sum of the subgroup mean deviations from the process target. It detects the shift of the process mean from the process target over time. The underlying distribution of the CumSum…
Read MoreCumSum Chart with Minitab
What is a CumSum Chart? The CumSum chart (also called cumulative sum control chart or CUSUM chart) is a control chart of monitoring the cumulative sum of the subgroup mean deviations from the process target. It detects the shift of the process mean from the process target over time. The underlying distribution of the CuSum…
Read MoreCreating an NP Chart with JMP
Creating an NP Chart with JMP What is NP Chart with JMP? The NP chart with JMP is a control chart monitoring the count of defectives using JMP statistical software to produce the results. It plots the number of defectives in one subgroup as a data point. The subgroup size of the NP chart is…
Read MoreNP Chart with SigmaXL
What is an NP Chart with SigmaXL? The NP chart with SigmaXL is a control chart monitoring the count of defectives. It plots the number of defectives in one subgroup as a data point. The subgroup size of the NP chart is constant. The underlying distribution of this control chart is binomial distribution. Plot an…
Read MoreNP Chart with Minitab
What is a NP Chart? The NP chart is a control chart monitoring the count of defectives. It plots the number of defectives in one subgroup as a data point. The subgroup size of the NP-chart is constant. The underlying distribution of this control chart is binomial distribution. Use Minitab to Plot an NP Chart…
Read MoreXbar S Chart with JMP
What is a Xbar S Chart? The X-S chart (also called Xbar S chart) is a control chart for continuous data with a constant subgroup size greater than ten. The Xbar chart plots the average of a subgroup as a data point. The S chart plots the standard deviation within a subgroup as a data…
Read MoreXbar S Chart with SigmaXL
What is a Xbar S Chart with SigmaXL? The Xbar S chart with SigmaXL (also called X-S chart) is a control chart for continuous data with a constant subgroup size greater than ten. The Xbar chart plots the average of a subgroup as a data point. The S chart plots the standard deviation within a…
Read MoreXbar S Chart with Minitab
What is a Xbar S Chart? The X-S chart (also called Xbar S chart) is a control chart for continuous data with a constant subgroup size greater than ten. The Xbar chart plots the average of a subgroup as a data point. The S chart plots the standard deviation within a subgroup as a data…
Read MoreOne Way ANOVA with JMP
What is One Way ANOVA? One way ANOVA is a statistical method to compare means of two or more populations. Null Hypothesis(H0):): μ1 = μ2 …= μk Alternative Hypothesis(Ha): At least one μi is different, where i is any value from 1 to k It is a generalized form of the two sample t-test since…
Read MoreTwo Sample Proportion Test with SigmaXL
What is the Two Sample Proportion Test with SigmaXL? The two sample proportion test with SigmaXL is a hypothesis test to compare the proportions of one certain event occurring in two populations following the binomial distribution. Null Hypothesis(H0): p1 = p2 Alternative Hypothesis(Ha): p1 ≠ p2 Two Sample Proportion Test Assumptions The sample data drawn…
Read MoreTwo Sample Proportion Test with JMP
What is the Two Sample Proportion Test? The two sample proportion test is a hypothesis test to compare the proportions of one certain event occurring in two populations following the binomial distribution. Null Hypothesis(H0): p1 = p2 Alternative Hypothesis(Ha): p1 ≠ p2 Two Sample Proportion Test Assumptions The sample data drawn from the populations of…
Read MorePaired t Test with JMP
What is the Paired t Test? A Third type of Two Sample t-Test is the Paired t Test. This test is used when the two populations are dependent of each other, so each data point from one distribution corresponds to a data point in the other distribution. When using a paired t test, the test…
Read MoreTwo Sample t Test with JMP
What is Two Sample t Test? Two sample t test is a hypothesis test to study whether there is a statistically significant difference between the means of two populations. Null Hypothesis (H0): μ1 = μ2 Alternative Hypothesis Ha) : μ1 ≠ μ2 Where: μ1 is the mean of one population and μ2 is the mean of…
Read MoreOne Sample Proportion Test with SigmaXL
What is the One Sample Proportion Test with SigmaXL? One sample proportion test with SigmaXL is a hypothesis test to compare the proportion of one certain outcome (e.g. the number of successes per the number of trials, or the number of defects per the total number of opportunities) occurring in a population following the binomial…
Read MoreOne Sample Proportion Test with JMP
What is the One Sample Proportion Test? One sample proportion test is a hypothesis test to compare the proportion of one certain outcome (e.g. the number of successes per the number of trials, or the number of defects per the total number of opportunities) occurring in a population following the binomial distribution with a specified…
Read MoreOne Sample Wilcoxon Test with JMP
What is the One Sample Wilcoxon Test? The one sample Wilcoxon test is a hypothesis test to compare the median of one population with a specified value. Null Hypothesis (H0): η = η0 Alternative Hypothesis (Ha): η ≠ η0 It is an alternative test of one sample t-test when the data distribution is non-normal. It is more powerful…
Read More