Pareto Chart
The Pareto Principle is commonly known as the “law of the vital few” or “80:20 rule”. It means that the majority (approximately 80%) of effects are the result of only a few (approximately 20%) of the causes. This principle was first introduced in the early 1900s by Wilfried Fritz Pareto, an Italian economist who observed that 80% of the country's land and wealth was owned by 20% of the population. His principal has been broadly applied in many other areas since that time and it has largely held. As a result, this "rule of thumb” is often used in business today.
Examples of Pareto Principle in application:
- 80% of the defects of a process come from 20% of the causes.
- 80% of sales come from 20% of customers.
The Pareto Principle helps us to focus on the vital few items that have the most significant impact on the response that we are most concerned with. In concept and application, this helps us find the root cause and prioritize potential improvement efforts.
Pareto Chart
The Pareto chart is a graphical display of descending bars with an ascending cumulative line on the top. The chart also has a table of defect counts by category as well as cumulative defects and cumulative percentages. Properly formatted Pareto charts should always show the descending bars on an axis with its scale relative to the total number of defects. Most modern analytical software packages will do this work for you. However, it's good to have a solid understanding of the Pareto chart anatomy so that you can use it to quickly draw conclusions and make decisions based on the information displayed on a Pareto chart.
Below is an interactive display of a Pareto chart. By clicking on any of the information buttons or the next button in the upper right hand corner of the graphic you can read about important aspects of Pareto charts.
Pareto Analysis
Pareto analysis is a process by which one can use several Pareto charts successively in order to "Drill Down" and identify root causes. In Pareto analysis, we drill down into the biggest bar to uncover the largest cause of defects for that category. This process can continue until a root cause is identified and/or you run out of data or categories to evaluate.
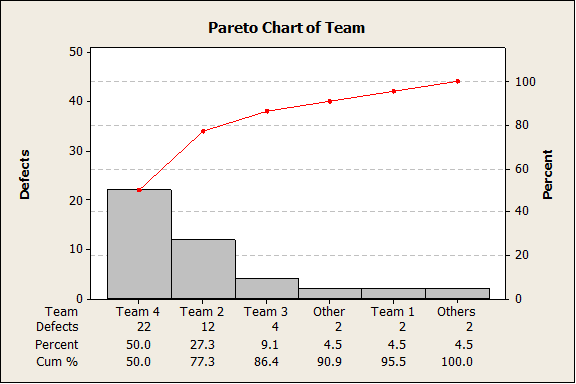
Let's look at an example of a three-level Pareto analysis. The next 3 charts represent defect information from an operation that has several teams producing work. Each team is made up of several sections (section groups) and each section is comprised of several associates. We have observed in the graph below that our operation defect rate appears to be highest with team 4 with 22 defects representing 50% of all defects.
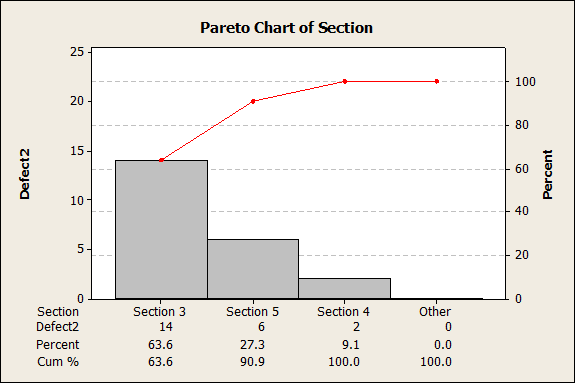
After being asked to figure out what the biggest reason is for all these defects we decided to first look into team 4 and break down the defects by section group within team four. As luck would have it, we notice that there is a large number of defects coming from section 3. Let's dig deeper...

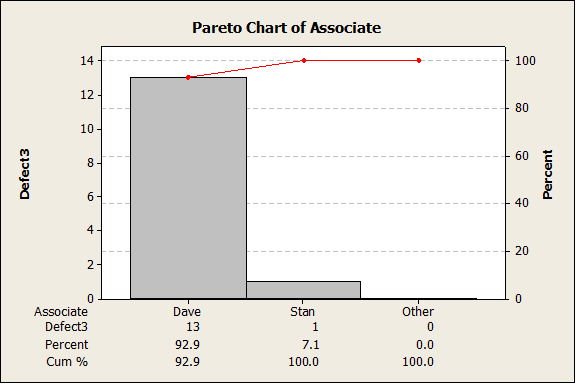
Digging Deeper, we see that section 3 has an associate who appears to be the culprit. Asking further questions and conducting a "Five Why" analysis we learn that Dave was out on leave when the operation underwent a systems upgrade and he did not receive the appropriate training on how the use the new functionality in the system. It was a minor detail but nearly everything Dave was doing was not compliant with product requirements. Dave received the training and began performing in line with his peers.

Pareto analysis can be very helpful in identifying and determining root cause. It's not a difficult or technically challenging analytical method and it can be easily understood by most people while being presented & explained to them.


