

Pareto Analysis with Minitab
What is Pareto Analysis with Minitab and the Pareto Principle?
The Pareto principle is an observation not a law. Named after Italian economist Vilfredo Pareto, this principle states that for a variety of situations, 80% of consequences come from 20% of the causes, thus the Pareto principle is also known as the 80/20 rule.
The 80/20 rule basically reminds us that the comparison of inputs and outputs is not balanced. Vilfredo Pareto used the rule to explain how 80% of the property in Italy was owned by 20% of the country's population. This rule can be applied to a wide variety of situations in manufacturing, management and human resources. Some examples for better understanding:
-
- 80% of company complaints comes from 20% of the customers
-
- Microsoft noted that by fixing 20% of the most reported bugs would eliminate 80% of the related errors in a given system
When you are trying to achieve top quality you need 100%. When optimizing your workforce, focusing on the few (20%) that are giving you issues is a timesaver. When you observe the 80% of the output stems from 20% of the input, the priority would be to focus on the few that generate the most results. The Pareto principle is a guideline to becoming more productive.
The Pareto principle helps us to focus on the vital few items that have the most significant impact. In concept, it also helps us to prioritize potential improvement efforts. Mr. Pareto is also credited for many works associated with the 80:20, some more loosely than others: Pareto's Law, Pareto efficiency, Pareto distribution etc.
Pareto Charts
A Pareto chart is a chart of descending bars with an ascending cumulative line on the top. Sum or Count: The descending bars on a Pareto chart may be set on a scale that represents the total of all bars or relative to the biggest bucket, depending on the software you are using.
Percent to Total: A Pareto chart shows the percentage to the total for individual bars.
Cumulative Percentage: A Pareto chart also shows the cumulative percentage of each additional bar. The data points of all cumulative percentages are connected into an ascending line on the top of all bars. Not all software packages display Pareto charts the same way. Some show the percent of total for each individual bar, and others show the cumulative percentage.
Pareto Charts Case Study
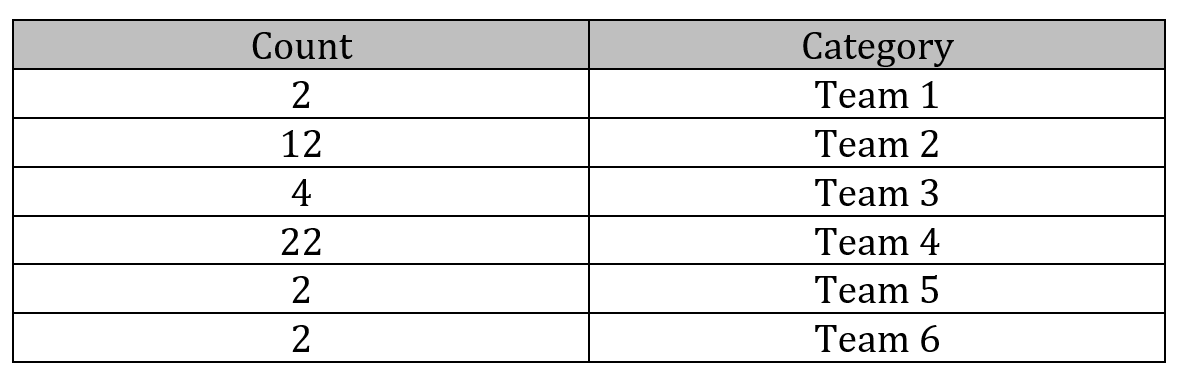
Next, we will use Minitab to run Pareto charts on the same data set. The following table shows the count of defective products by team. Input the tabled data below into your software program and follow the instructions over the next few pages to run Pareto charts.
 Create a Pareto Chart in Minitab
Steps to generate a Pareto chart using Minitab:
- Open Minitab and type or copy the data from table 1.2 into the Minitab worksheet.
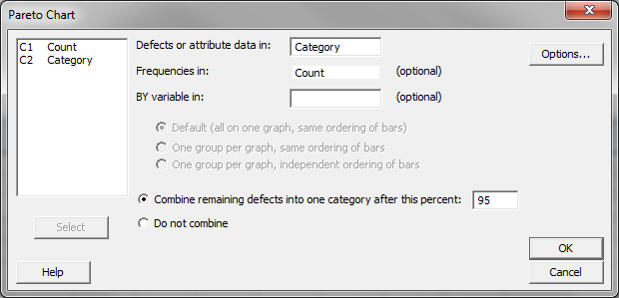
- Click on Stat → Quality Tools → Pareto Chart. A new window with the title "Pareto Chart" pops up.
- Select "Category" into the "Defects or attribute data in" box.
- Select "Count" into the box "Frequency in."
- Click "OK."
The Pareto chart output is created in a newly-generated window. Figure 1.32 depicts the Pareto chart generated by Minitab. It represents the count of defective products by team. The bars are descending on a scale with the peak at 50, which is a rounded approximation of the total count of all defective products for all teams. The table below the chart contains counts, individual percentages, and cumulative percentages. Lastly, cumulative percentages are represented by the data points driving the line that spans across the top of the graphic.

With this data and analysis, we were looking to determine how many defective products (i.e. effects) were created by each team (i.e. causes). As you can see, Minitab sorted the data in decreasing order. The team with the most defective products (team 4) was placed on the left. The total number of defects is 44 which you can estimate by glancing at where the cumulative line ends (the cumulative percentage line (red line) shows what each team, cumulatively is contributing as a percentage to the total number of defects). It's also notable that nearly 80% of the defects are contributed by nearly 20% of the causes. Thus, the Pareto principle holds true.
Pareto Analysis with Minitab
The Pareto analysis with Minitab is used to identify root causes by using multiple Pareto charts. In Pareto analysis, we drill down into the bigger buckets of defects and identify the root causes of defects that contribute heavily to total defects. This drill-down approach often effectively solves a significant portion of the problem. Next you will see an example of three-level Pareto analysis.
-
- The second-level Pareto is a Pareto chart that is a subset of the tallest bar on the first Pareto. Therefore, the chart will represent categorized defects of Team 4.
-
- The third-level Pareto will then be a subset of the tallest bar of the second-level Pareto.
Pareto Analysis: First Level
The first-level Pareto was already demonstrated in figure 1.32. It showed the count of defective items by team. In that first level Pareto we concluded that Team 4 accounted for 50% of the total number of defects. The next level Pareto will be a second level and will only show the defective items from Team 4 categorized in a logical manner or in a way that the data allows.
Pareto Analysis: Second Level

The second-level Pareto shows the count of the defective items by section for only Team 4 (22 defects). You can see that teams are broken down to sections and it appears that section 3 accounts for 63% of the total defects for team 4.
Pareto Analysis: Third Level
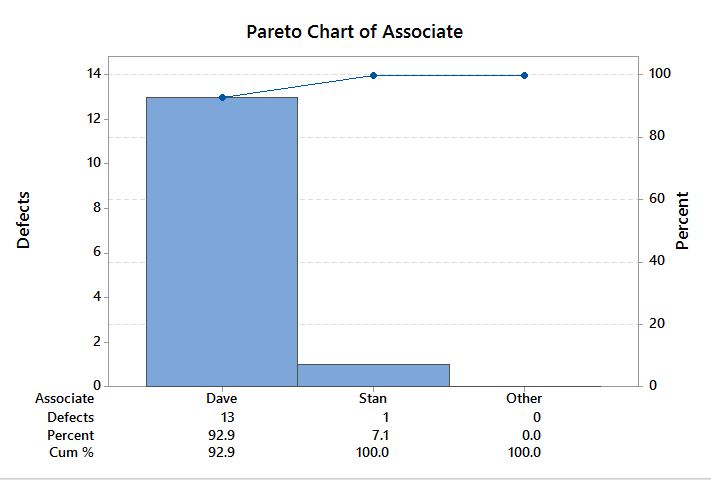
The third-level Pareto shows the count of defective items by associate for only Section 3 of Team 4. The total defects by associate sum to the total for Section 3 and Dave accounts for 93% of Section 3's defects.
Pareto Analysis: Conclusion
Model summary: Our analysis clearly shows the root of the problem being associate Dave who has 13 of the 14 defects in Section 3 of Team 4. Through this multi-level Pareto analysis, instead of focusing on all teams to reduce the number of defects, we discovered that we can focus on a single individual who is contributing 13 defects out of a total of 44 which is 30% of the total for all teams. Determining what Dave might be doing differently or wrong and solving that problem could fix about 30% of the entire defective products (13/44). This type of analysis significantly narrowed the focus necessary for reducing defective products.
