One Sample Wilcoxon Test with Minitab
What is the One Sample Wilcoxon Test?
The one sample Wilcoxon test is a hypothesis test to compare the median of one population with a specified value.
-
- Null Hypothesis (H0): η = η0
-
- Alternative Hypothesis (Ha): η ≠ η0
It is an alternative test of one sample t-test when the distribution of the data is non-normal. It is more powerful than one sample sign test but it assumes the distribution of the data is symmetric.
One Sample Wilcoxon Test Assumptions
-
- The sample data drawn from the population of interest are unbiased and representative.
-
- The data are continuous or ordinal when the spacing between adjacent values is not constant.
-
- The distribution of the data is symmetric about a median.
-
- The one sample Wilcoxon test is robust for the non-normally distributed population.
The assumptions are similar to other non-parametric tests, again the difference about the symmetry of the distribution.
How the One Sample Wilcoxon Test Works
Step 1: Create the following columns one by one:
-
- Column 1: All the raw observations (X)
-
- Column 2: The differences between each observation value and the hypothesized median (X - η0)
-
- Column 3: The signs (+ or -) of column 2
-
- Column 4: The absolute value of column 2
-
- Column 5: The ranks of each item in column 4 in ascending order
-
- Column 6: The product of column 3 and column 5
Step 2: Calculate the test statistic Wcalc , which is the sum of all the non-negative values in column 6.
Step 3: Make a decision on whether to reject the null hypothesis. Use the table of critical values for the Wilcoxon test to get the Wcrit with a predetermined alpha level and the number of observations.
If the Wcalc is smaller than the Wcrit, we fail to reject the null hypothesis and claim that there is no significant difference between the population median and the hypothesized median. To calculate the W statistic, sum all of the non-negative values in column 6. To assess the hypothesis, the W statistic is compared against the critical W value.
Use Minitab to Run a One Sample Wilcoxon Test
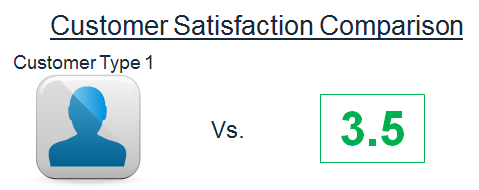
Case study: We are interested in comparing the overall satisfaction of customer type 1 against a specified benchmark satisfaction (3.5) using a nonparametric (i.e. distribution-free) hypothesis test: one sample Wilcoxon test.
Data File: "One Sample Wilcoxon" tab in "Sample_Data.xlsx"

-
- Null Hypothesis (H0): η1 = 3.5
-
- Alternative Hypothesis (Ha): η1 ≠ 3.5
Steps to run a one sample Wilcoxon test in Minitab:
- Click Stat → Nonparametrics → 1-Sample
- A new window named "1-SampleWilcoxon" pops up
- Select "Overall Satisfaction" as the "Variables."
- Click the radio button "Test median."
- Enter "3.5" in the box next to "Test median."

- Click "OK."
- The one sample Wilcoxon test results appear in the session window.
Model summary: The p-value of the one sample Wilcoxon test is 0.557, higher than the alpha level (0.05), and we fail to reject the null hypothesis. There is not any statistically significant difference between the overall satisfaction of customer type 1 and the benchmark satisfaction level.
Join Our Community
Instant access to hundreds of "How to" articles, Tools, Templates, Roadmaps, Data-Files.. Everything Lean Six Sigma! Come on in! Welcome to our community of Lean Six Sigma certified professionals.


