Creating an NP Chart with JMP
Creating an NP Chart with JMP
What is NP Chart with JMP?
The NP chart with JMP is a control chart monitoring the count of defectives using JMP statistical software to produce the results. It plots the number of defectives in one subgroup as a data point. The subgroup size of the NP chart is constant. The underlying distribution of this control chart is a binomial distribution.
NP Chart Equations
NP-chart
Data Point:
![]()
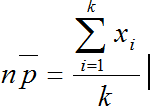
Center Line:

Control Limits:
![]()
Where:
- n is the constant subgroup size
- k is the number of subgroups
- xi is the number of defectives in the ith subgroup
Use JMP to Plot an NP Chart
Data File: "NP.jmp"
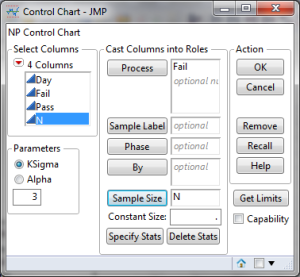
Steps to plot an NP-chart in JMP:
- Analyze -> Quality & Process -> Control Chart -> NP
- Select Fail in the Process Field
- Select N in the Sample Size Field

- Click Ok
NP Chart Diagnosis
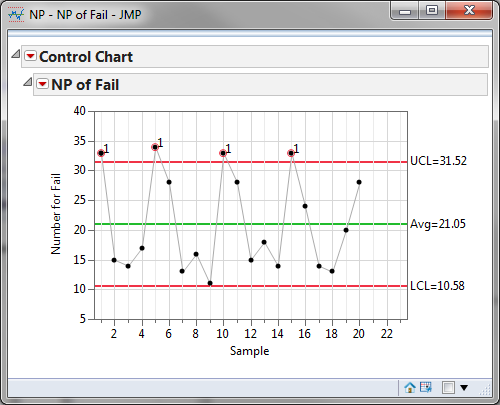
Model summary: Four data points, circled in red, fall beyond the upper control limit. We conclude that the NP chart is out of control. Further investigation is needed to determine the special causes that triggered the unnatural pattern of the process.


