

IR Chart with Minitab
What is an IR Chart?
The IR chart (also called individual-moving range chart or I-MR chart) is a popular control chart for continuous data with subgroup size equal to one.
- The I chart plots an individual observation as a data point.
- The MR chart plots the absolute value of the difference between two consecutive observations in individual charts as a data point.
If there are n data points in the I chart, there are n –1 data points in the MR chart. The I chart is valid only if the MR chart is in control. The underlying distribution of the I-MR chart is normal distribution.
Use Minitab to Plot I-MR Charts
Data File: “IR” tab in “Sample Data.xlsx”
Steps to plot IR charts in Minitab:
- Click Stat → Control Charts → Variable Charts for Individuals → I-MR.
- A new window named “Individuals – Moving RangeChart” appears.
- Select “Measurement” as the “Variables.”
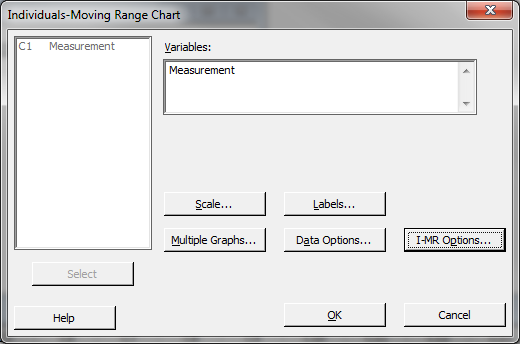
- Click “I-MROptions” button and a new window “Individual – Moving Range Chart – Options” appears.
- Click on the tab “Tests.”
- Select the item “Perform all tests for special causes” in the dropdown box.
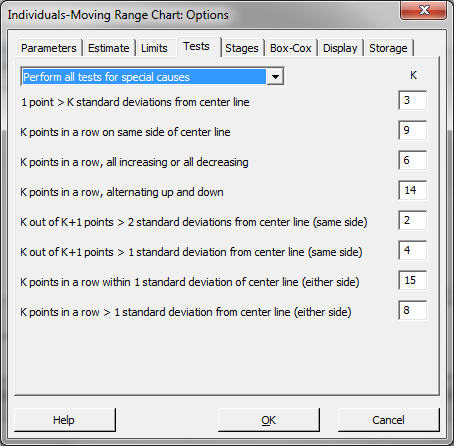
- Click “OK” in the window “Individuals – Moving RangeChart Options.”
- Click “OK.”
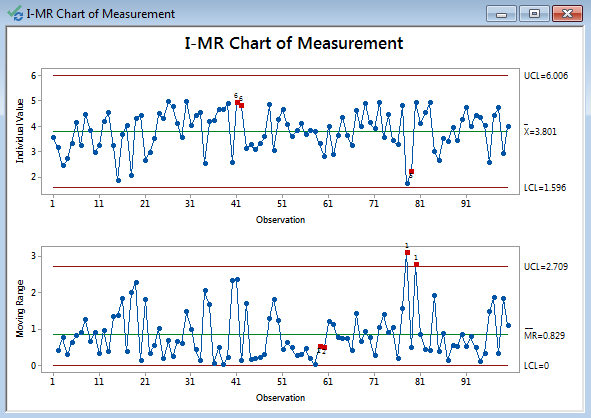
- The IR charts appear in the newly-generated window.
I-MR Charts Diagnosis
Model summary:
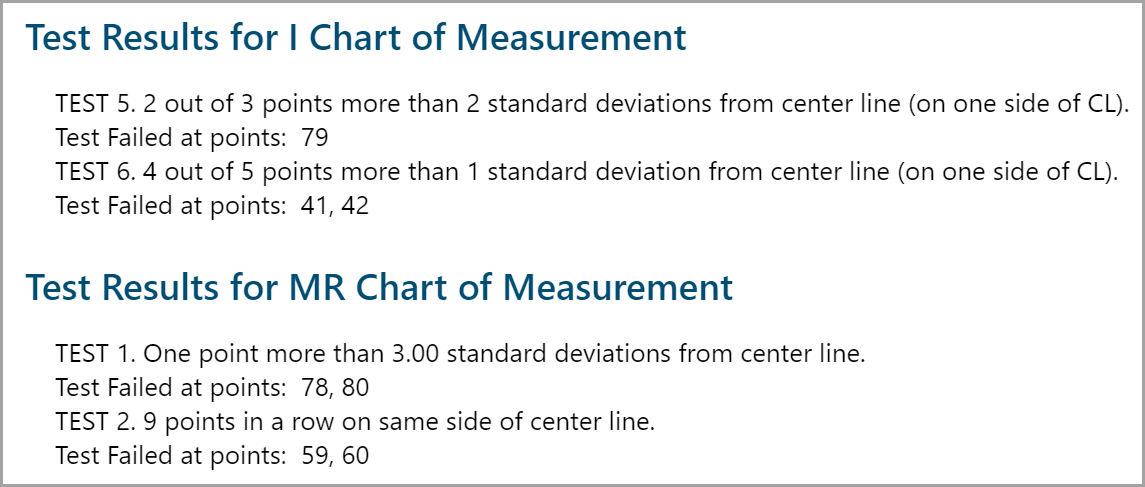
I Chart (Individuals’ Chart): Since the MR chart is out of control, the I chart is invalid.
MR Chart (Moving Range Chart): Two data points fall beyond the upper control limit. This indicates the MR chart is out of control (i.e., the variations between every two contiguous individual samples are not stable over time). We need to further investigate the process, identify the root causes that trigger the outliers, and correct them to bring the process back in control.
