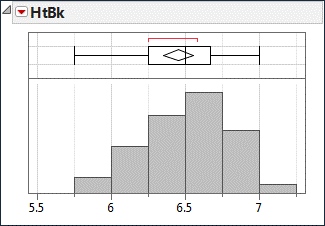
Box Plot with JMP
What is a Box Plot?
A box plot is a graphical method to summarize a data set by visualizing the minimum value, 25th percentile, median, 75th percentile, the maximum value, and potential outliers. A percentile is the value below which a certain percentage of data fall. For example, if 75% of the observations have values lower than 685 in a data set, then 685 is the 75th percentile of the data. At the 50th percentile, or median, 50% of the values are lower and 50% are higher than that value.
Box Plot Anatomy

The figure above describes how to read a box plot. Here are a few explanations that may help. The middle part of the plot, or the “interquartile range,” represents the middle quartiles (or the 75th minus the 25th percentile). The line near the box's middle represents the data set's median (or middle value). The whiskers on either side of the IQR represent the lowest and highest quartiles of the data. The ends of the whiskers represent the maximum and minimum of the data, and the individual dots beyond the whiskers represent outliers in the data set.
How to Use JMP to Generate a Box Plot
Data File:“BoxPlot.jmp”
Steps to render a Box Plot in JMP:
- Click Analyze -> Distribution
- Select “HtBk” as “Y, Columns”

- Click “OK”
- Click on the red triangle button next to “HtBk”
- Uncheck Histogram Options -> Vertical


What is the red line and diamond? I think the diamond down it’s center is the mean but what does the rest of the diamond represent?